
Gom3rye
팀 프로젝트) Node Exporter/prom agent 본문
- Node Exporter → Prometheus Agent → Prometheus → Grafana 흐름
Node Exporter: 노드의 시스템 메트릭을 수집하고 /metrics로 노출
Prometheus Agent: 노드 익스포터에서 노출한 메트릭을 scrape(수집)하고 저장/전송
즉, Node Exporter는 메트릭을 노출하는 역할, Prometheus-agent는 그것을 긁어가는 역할
node-exporter-rbac.yaml
- ServiceAccount: Prometheus가 사용할 "ID" (Prometheus는 메트릭을 수집할 때 API 서버에 접근한다. 그때 사용하는 ID가 ServiceAccount)
- ClusterRole: 어떤 권한을 가질지 정의 (ServiceAccount가 어떤 API 리소스에 접근 가능한지를 결정)
- ClusterRoleBinding: 권한을 ServiceAccount에 연결
apiVersion: v1
kind: ServiceAccount # 기본 계정(default) 대신, 역할을 명확히 나누기 위해 별도 계정(node-exporter)를 만든다.
metadata:
  name: node-exporter
  namespace: prometheus
---
apiVersion: rbac.authorization.k8s.io/v1
kind: ClusterRole
metadata:
  name: node-exporter
rules:
- apiGroups: [""] # core API group (v1 API)
  resources:
    - nodes
    - nodes/proxy
    - nodes/metrics
    - services
    - endpoints
    - pods
  verbs: ["get", "list", "watch"] # 허용된 작업 종류
- nonResourceURLs: ["/metrics", "/metrics/cadvisor", "/metrics/resource"]
  verbs: ["get"]
---
apiVersion: rbac.authorization.k8s.io/v1
kind: ClusterRoleBinding # 위에서 정의한 ClusterRole(node-exporter)을 ServiceAccount에 실제로 부여
metadata:
  name: node-exporter
roleRef:
  apiGroup: rbac.authorization.k8s.io
  kind: ClusterRole
  name: node-exporter
subjects:
- kind: ServiceAccount
  name: node-exporter
  namespace: prometheus
Kubernetes는 API 요청이 두 가지 종류로 나뉜다.

node-exporter-daemonset.yaml
apiVersion: apps/v1
kind: DaemonSet
metadata:
  name: node-exporter
  namespace: prometheus
  labels:
    app: node-exporter
spec:
  selector:
    matchLabels: # 어떤 Pod들을 이 DaemonSet이 관리할지 결정. Pod의 label과 일치해야 함
      app: node-exporter
  template:
    metadata:
      labels: # Pod에 붙는 라벨 정의. selector와 일치해야 함
        app: node-exporter
    spec:
      serviceAccountName: node-exporter
      hostNetwork: true
      hostPID: true
      containers:
      - name: node-exporter
        image: quay.io/prometheus/node-exporter:v1.8.1
        args: # Node Exporter에 전달하는 실행 인자
          - --path.rootfs=/ # 기본값으로, 루트 파일 시스템을 그대로 사용
        ports:
        - name: metrics
          containerPort: 9100
          hostPort: 9100 # hostPort를 열면, Prometheus가 http://<노드 IP>:9100/metrics로 바로 접근 가능해진다.
        resources:
          requests: # 최소 보장 리소스
            cpu: 50m
            memory: 64Mi
          limits: # 최대 보장 리소스
            cpu: 200m
            memory: 200Mi
| 옵션 | 설명 |
| hostNetwork: true | 이 Pod는 노드의 네트워크를 직접 사용함. 즉, Pod IP = 노드 IP |
| hostPID: true | 이 Pod는 호스트의 프로세스 네임스페이스를 공유함. 시스템 PID 접근 가능 |
Node Exporter는 시스템 정보를 수집해야 하므로, 이러한 host-level 접근이 필요하다.
기본적으로 각 Pod/컨테이너는 자기만의 PID 공간을 가져서 컨테이너는 호스트의 다른 프로세스를 볼 수 없음 But, 위의 설정으로 Pod의 PID 네임스페이스를 호스트와 공유하게 만들어서 호스트 전체의 프로세스를 볼 수 있게 됨
node-exporter-svc.yaml
apiVersion: v1
kind: Service
metadata:
  name: node-exporter
  namespace: prometheus
  labels:
    app: node-exporter
spec:
  clusterIP: None                # headless service → Pod 엔드포인트 직접 노출
  ports:
  - name: metrics
    port: 9100
    targetPort: 9100
  selector:
    app: node-exporter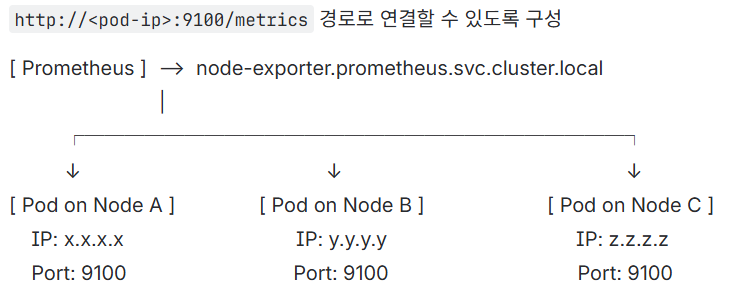
왜 headless service를 써야 하나요?
- 노드 익스포터는 데몬셋으로 각 노드에 1개씩 파드가 배포되는 구조이므로 일반 ClusterIP 서비스(라운드로빈)로 접근하는 건 적절하지 않는다.
- 프로메테우스는 각 파드의 ip를 알아야 한다. 따라서 headless service를 써서 프로메테우스가 각 노드의 node-exporter Pod에 직접 접근해서 메트릭을 scrape하도록 구성해줘야 한다.
prom-agent-rbac.yaml
# prom-agent-rbac.yaml
apiVersion: v1
kind: ServiceAccount
metadata:
  name: prom-agent
  namespace: prometheus
---
apiVersion: rbac.authorization.k8s.io/v1
kind: ClusterRole
metadata:
  name: prom-agent
rules:
- apiGroups: [""]
  resources: ["nodes", "nodes/metrics", "nodes/proxy", "services", "endpoints", "pods"]
  verbs: ["get", "list", "watch"]
- nonResourceURLs: ["/metrics", "/metrics/cadvisor"]
  verbs: ["get"]
---
apiVersion: rbac.authorization.k8s.io/v1
kind: ClusterRoleBinding
metadata:
  name: prom-agent
roleRef:
  apiGroup: rbac.authorization.k8s.io
  kind: ClusterRole
  name: prom-agent
subjects:
- kind: ServiceAccount
  name: prom-agent
  namespace: prometheus
prom-agent-config.yaml
apiVersion: v1
kind: ConfigMap
metadata:
name: prom-agent-config
namespace: prometheus
data:
prometheus.yml: |
global:
scrape_interval: 15s
evaluation_interval: 15s
external_labels:
cluster: datacenter
###############################################################
# ✅ 1) 노드 메트릭: node-exporter
###############################################################
scrape_configs:
- job_name: 'node-exporter'
kubernetes_sd_configs:
- role: endpoints
namespaces:
names: ['prometheus']
relabel_configs:
- source_labels: [__meta_kubernetes_service_name]
action: keep
regex: node-exporter
- source_labels: [__meta_kubernetes_namespace]
action: keep
regex: prometheus
- source_labels: [__meta_kubernetes_endpoint_port_name]
action: keep
regex: metrics
###############################################################
# ✅ 2) 컨테이너 리소스 메트릭: cAdvisor
###############################################################
- job_name: 'kubelet-cadvisor'
scheme: https
metrics_path: /metrics/cadvisor
kubernetes_sd_configs:
- role: node
tls_config:
ca_file: /var/run/secrets/kubernetes.io/serviceaccount/ca.crt
insecure_skip_verify: true
bearer_token_file: /var/run/secrets/kubernetes.io/serviceaccount/token
relabel_configs:
- action: replace
source_labels: [__address__]
regex: (.+):\d+
replacement: ${1}:10250
target_label: __address__
- action: labelmap
regex: __meta_kubernetes_node_label_(.+)
- action: replace
source_labels: [__meta_kubernetes_node_name]
target_label: instance
###############################################################
# ✅ 3) 클러스터 상태 메트릭: kube-state-metrics
###############################################################
- job_name: 'kube-state-metrics'
kubernetes_sd_configs:
- role: endpoints
namespaces:
names: ['prometheus', 'service', 'system']
relabel_configs:
- source_labels: [__meta_kubernetes_service_name]
action: keep
regex: kube-state-metrics
- source_labels: [__meta_kubernetes_namespace]
action: keep
regex: (prometheus|service|system)
###############################################################
# ✅ 4) Pod 자동탐색 (annotation 기반)
###############################################################
- job_name: 'kubernetes-pods'
kubernetes_sd_configs:
- role: pod
namespaces:
names: ['prometheus', 'service', 'system']
relabel_configs:
- action: keep
source_labels: [__meta_kubernetes_pod_annotation_prometheus_io_scrape]
regex: "true"
- action: replace
source_labels: [__meta_kubernetes_pod_annotation_prometheus_io_path]
target_label: __metrics_path__
- action: replace
source_labels: [__address__, __meta_kubernetes_pod_annotation_prometheus_io_port]
regex: (.+):(?:\d+);(.+)
replacement: ${1}:${2}
target_label: __address__
- action: replace
source_labels: [__meta_kubernetes_namespace]
target_label: namespace
- action: replace
source_labels: [__meta_kubernetes_pod_name]
target_label: pod
- action: labelmap
regex: __meta_kubernetes_pod_label_(.+)
###############################################################
# ✅ 5) Remote Write: 중앙 Prometheus로 전송
###############################################################
remote_write:
- url: "http://192.168.1.233:9090/api/v1/write"
queue_config:
max_shards: 8
capacity: 20000
max_samples_per_send: 5000💡 external_labels는 multi-cluster 환경에서 메트릭 출처 식별에 중요하다.
prom-agent-deploy.yaml
apiVersion: apps/v1
kind: Deployment
metadata:
  name: prom-agent
  namespace: prometheus
  labels:
    app: prom-agent
spec:
  replicas: 1
  selector:
    matchLabels:
      app: prom-agent
  template:
    metadata:
      labels:
        app: prom-agent
    spec:
      serviceAccountName: prom-agent
      containers:
        - name: prometheus-agent
          image: prom/prometheus:v2.52.0
          args:
            - --config.file=/etc/prometheus/prometheus.yml
            - --enable-feature=agent
            - --storage.agent.path=/prom-agent
            - --web.enable-lifecycle
          ports:
            - name: http
              containerPort: 9090
          resources:
            requests:
              cpu: "200m"
              memory: "256Mi"
            limits:
              cpu: "1"
              memory: "1Gi"
          volumeMounts:
            - name: config
              mountPath: /etc/prometheus
            - name: wal
              mountPath: /prom-agent
      volumes:
        - name: config
          configMap:
            name: prom-agent-config
        - name: wal
          persistentVolumeClaim:
            claimName: prom-agent-wal
prom-agent-pvc.yaml
# prom-agent-pvc.yaml
apiVersion: v1
kind: PersistentVolumeClaim
metadata:
  name: prom-agent-wal
  namespace: prometheus
spec:
  accessModes: ["ReadWriteOnce"]
  storageClassName: local-path
  resources:
    requests:
      storage: 10Gi
여기서 잠깐..!
위에는 노드 단위의 메트릭만 수집하는 것이고 cAdvisor와 kube-state-metrics를 이용하면 서비스 단위 메트릭도 수집 가능하다!
What is cAdvisor?
- 컨테이너 안에서 일어나는 일을 실시간으로 감시하는 도구 (즉, 컨테이너 안 리소스 사용량 모니터링)
- CPU, 메모리, 디스크 사용량 같은 리소스 사용량을 모니터링한다.
- Kubelet 안에 기본으로 포함되어 있고 따로 설치할 필요 없다.
- Prometheus가 이 정보를 가져가서 그래프로 보여줄 수 있다.
- Ex) 이 컨테이너가 CPU를 너무 많이 쓰고 있어요.
What is kube-state-metrics?
- 쿠버네티스 오브젝트(자원)들의 상태를 숫자로 보여주는 도구
- 파드(Pod), 노드(Node), 디플로이먼트(Deployment), 서비스(Service) 같은 쿠버네티스 자원이 몇 개인지, 정상인지 알려준다.
- 실제 사용량은 아니고 상태 정보만 보여준다.
- kubelet에 내장되지 않아 별도 설치가 필요하다. (디플로이먼트로 띄우기)
- Prometheus가 이 정보를 수집해서 알림을 보내거나 시각화할 수 있다.
- Ex) Ready 상태가 아닌 파드가 3개 있어요. 전체 노드는 5개인데 1개가 다운됐어요.
Prometheus Agent 권한 업데이트
- 기존 파일의 resources: ["nodes", "nodes/metrics", "services", "endpoints", "pods"] 부분에 nodes/proxy 부분을 추가 → cAdvisor 메트릭을 수집하기 위해 필요
- resources: ["nodes", "nodes/metrics", "nodes/proxy", "services", "endpoints", "pods"]
- nonResourceURLs: ["/metrics"] 부분에 "/metrics/cadvisor" 경로 추가
여기서 또 잠깐..!
Q1. Fluent Bit에서 로그를 태그(Tag)로 분기하여 별도의 파이프라인(Kafka 토픽)으로 보내는 것처럼, Prometheus도 메트릭을 라벨(Label)을 사용해 완벽하게 구분하고 분리해서 조회할 수 있나?
정답: Yes.
방식에 약간 차이가 있는 것 뿐 완벽하게 분리해서 조회 가능
- Fluent Bit (Routing 관점): 로그 데이터에 태그를 붙여 물리적으로 다른 경로(Stream)로 보낸다. (service 로그는 A 토픽으로, oom 로그는 B 토픽으로).
- 비유하자면 주제별 서가 (역사 책은 역사 서가에, 과학 책은 과학 서가에 두는 방식)
- Prometheus (Querying 관점): 모든 메트릭을 하나의 거대한 데이터베이스에 저장하되, 각각의 메트릭에 수많은 라벨(꼬리표)을 붙여놓는다. 사용자는 쿼리(PromQL)를 통해 원하는 라벨이 붙은 메트릭만 골라서 볼 수 있다.
- 모든 책을 거대한 중앙 서가에 꽂아두고 대신 역사, 과학, 2024 출판, 저자:김민준 등 수많은 색인 스티커(라벨)을 붙여놓는다.
- 이 방식이 훨씬 유연한 방식. Datacenter 클러스터의 ‘service-A’ Pod 중에서 CPU 사용량이 가장 높은 Pod 와 같이 여러 조건을 조합해서 데이터를 자유자재로 분석할 수 있기 때문.
node-exporter, cAdvisor, kube-state-metrics는 각각의 메트릭에 출처를 명확히 알 수 있는 라벨을 자동으로 붙여주기 때문에 Prometheus는 ‘서비스’와 ‘시스템' 메트릭을 구분할 수 있다.
datacenter cluster → LMV Prometheus 간에 노드, 파드, 클러스터 상태, 애플리케이션 메트릭까지 전부 자동으로 전달된다.
local-path 설치하는 방법
kubectl apply -f https://raw.githubusercontent.com/rancher/local-path-provisioner/master/deploy/local-path-storage.yaml
'현대 오토에버 클라우드 스쿨' 카테고리의 다른 글
| 팀 프로젝트) AWS Lambda 함수 (1) | 2025.11.11 |
|---|---|
| 팀 프로젝트) Kafka (0) | 2025.11.11 |
| 팀 프로젝트) FluentBit + Fluentd (0) | 2025.11.11 |
| 팀 프로젝트) Fluent Bit tag 작성 시 고려해야 할 점: 강한 결합 vs. 느슨한 결합 (0) | 2025.11.06 |
| 팀 프로젝트) Fluent Bit -> Fluentd tag rewrite의 이점 (0) | 2025.11.06 |